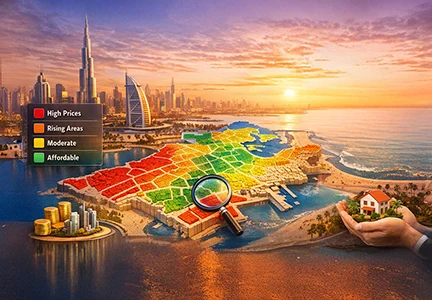
Dubai Property Price Heatmap 2026: Smart Investment Guide

Dubai Property Price Heatmap 2026: Smart Investment Guide

Dubai Property Price Heatmap 2026, a smart tool to track property price trends, high-demand areas, and emerging investment hotspots. Learn where to invest in Dubai real estate for better ROI, rental yield, and long-term property growth.

What is a Property Heatmap? Think of a property heatmap as a "weather map" for real estate. Just like a weather map uses colors to show where it’s hot or cold, a property heatmap uses colors to show you where the market is moving.

  • Red or Warm Zones: These aren't just expensive areas; they are "hotspots" where prices are rising fast, demand is high, or new infrastructure (like the Metro Blue Line) is being built.
  • Blue or Cool Zones: These represent areas where prices are stable or more affordable. In 2026, these are often the "hidden gems" where you can get more square footage for your money before the next big project arrives.

Why Property Heatmap in Dubai helps the buyers or investors?

Instead of looking at a boring spreadsheet of numbers, the heatmap lets an investor see the opportunity at a glance. It helps them answer two vital questions instantly:

  • "Where is everyone else buying?" (The established hotspots)
  • "Where is the next big wave coming?" (The emerging zones)

In the current time, the investors are no longer throwing money at every flashy brochure." We are now in the Infrastructure-Led Value phase. To find the "best deal" today, you have to look past the shiny brochures and focus on three metrics: Metro Proximity, Aerotropolis Integration, and Net Yield Efficiency.

This is a technical breakdown of the 2026 landscape for investors who prioritize hard data over marketing narratives. 

How does a Dubai property heatmap help the investors/buyers?

For an investor, it functions as a real-time risk-assessment engine, instantly cross-referencing high-frequency transaction data, infrastructure milestones like the Metro Blue Line and net-yield fluctuations. Instead of actually just assuming which is going to be the best area to invest in, with the use of the Dubai Property heatmap, they can pinpoint exact coordinates where the capital appreciation curve is just beginning to steepen. It effectively replaces the traditional "gut feeling" with a transparent, data-led confirmation of where your money will work the hardest, distinguishing a genuine growth corridor from a stagnant, oversupplied trap.

  • Absorption Rate: How fast units in a specific cluster are selling. A "Red" zone indicates that supply is being swallowed faster than it is being launched.
  • Rental Delta: The difference between current market rent and the "asking" rent of new listings.
  • Infrastructure Proximity (The 800m Rule): Heatmaps in 2026 automatically highlight properties within an 800-meter radius of the Metro Blue Line or the DWC Airport expansion.
  • Price Lag Analysis: It identifies "Cool" pockets areas where prices haven't yet caught up to the surrounding community’s growth.
Latest Projects In Dubai
View All Projects
Emaar Fior 1 at Rashid Yachts & Marina

Emaar Fior 1 at Rashid Yachts & Marina

2.2 M*
1, 2 & 3 BR
760 - 1,592 Sq. Ft.
Apartments
Emaar Terra Woods at Dubai South

Emaar Terra Woods at Dubai South

1.6 M*
1, 2 & 3 BR
742 - 2,580 Sq. Ft.
Apartments & Townhouses
Binghatti Skyflame at Dubailand

Binghatti Skyflame at Dubailand

0.69 M*
1 & 2 BR
Coming Soon
Studios & Apartments
Mercedes-Benz Places Binghatti City at Meydan

Mercedes-Benz Places Binghatti City at Meydan

1.3 M*
1, 2, 3, 4 & 5 BR
361 - 3776 Sq. Ft.
Studios & Apartments
Sobha Sanctuary at Dubailand

Sobha Sanctuary at Dubailand

4.86 M*
4 BR
1,800 Sq. Ft.
Townhouses & Villas
Emaar Serro at The Heights Country Club

Emaar Serro at The Heights Country Club

6.5 M*
3, 4 & 5 BR
3,402 - 5,828 Sq. Ft.
Villas

How to find Off-Plan vs. Ready to move properties with the help of property heatmap in Dubai?

One of the biggest advantages of a heatmap in Dubai is the ability to filter by Construction Status. This allows you to spot specific tactical opportunities:

Finding Off-Plan Property

Heatmaps in Dubai reveal where developers are concentrating new launches.

  • The Data Play: Look for "Clusters of Activity." If a heatmap shows a high density of new off-plan launches in Dubai South (Zone A), it signals a collective institutional bet on that area’s infrastructure.
  • Capital Appreciation: By tracking the "color shift" over 12 months, you can see if an off-plan area is appreciating during construction. If the zone turns from Blue (Affordable) to Yellow (Moderate) while the building is still at 40% completion, you have a high-probability "exit" profit before handover.

Spotting Ready-to-Move Value

  • The "Yield Pressure" Map: Use the heatmap to find "Ready" units in areas with high rental demand but low new supply.
  • Example: In 2026, JVC and Arjan often show as "Bright Red" for occupancy. A buyer can use the heatmap to find the exact street or sub-community within JVC where prices are still "Cool" (Blue) but occupancy is "Hot" (Red). This is the Maximum Yield Sweet Spot.

Can I find the Best Builder in Dubai with the help of the property heatmap?

Yes. In 2026, advanced heatmaps allow you to overlay Developer Performance Data. This is the ultimate "brochure-free" reality check.

Heatmap Metric for Developers What it Tells the Investor
Secondary Market Premium Does a "Binghatti" or "Emaar" building in the same area sell for 15% more than its neighbor? The heatmap shows this price gap instantly.
Rent Stability Which developers' buildings maintain high rents 5 years after handover? Heatmaps track the "decay" or "growth" of rental value by builder.
Handover Consistency Some heatmaps now color-code developers by their "on-time" delivery record. A "Green" developer has a <5% delay rate; a "Red" developer is a risk.

The "Developer Signature" Heatmap

Instead of trusting a name, you look at the Resale Heatmap. If you see that Developer A’s buildings in Business Bay consistently trade at a 20% premium over Developer B’s buildings on the same street, the heatmap has just told you who the "popular" and "trusted" builder is through hard transaction data, not marketing.

How can I find the highest rental yields with the help of property heatmap in Dubai?

The city is no longer moving in unison. We categorize 2026 Dubai into four "Thermal Zones" based on how fast prices are moving and how much cash they generate.

Zone A: The "Infra-Hot" Corridor (Capital Growth Focus)

These areas are seeing the highest price jumps due to the Dubai Metro Blue Line and Al Maktoum International (DWC) expansion.

  • Dubai South & Expo City: Prices surged 15-20% YoY in 2025. Yet, at AED 1,100/sq. ft., they remain 60% cheaper than Downtown. This is your "Equity Accumulator."
  • Dubai Creek Harbour: Now the "New Downtown." It is seeing a 14% appreciation rate as the first Blue Line station milestones are met.

Zone B: The "Yield Engines" (Cash-Flow Focus)

Where high occupancy meets low entry costs.

  • Jumeirah Village Circle (JVC): The consistent ROI leader. In 2026, JVC maintains a Net Yield of ~7.4% (after costs).
  • Arjan & Dubai Silicon Oasis (DSO): DSO has seen a 25% rental spike since the Blue Line announcement, becoming a primary transit node for the eastern corridor.

Can I compare community ROI with the help of Dubai property heatmap?

To find the "Best Deal," you must look at the Net Spread, what stays in your pocket after service charges and fees.

Community Price (AED/PSF) Gross Yield Service Charges Net Yield (Real)
JVC (Mid-Rise) 1,450 – 1,550 8.8% AED 12 – 14 7.4%
Dubai South 1,100 – 1,250 8.2% AED 10 – 12 7.1%
DSO 1,150 – 1,300 8.5% AED 11 – 13 7.3%
Business Bay 2,300 – 2,700 6.8% AED 18 – 25 5.4%
Creek Harbour 2,100 – 2,500 6.4% AED 16 – 20 5.2%

The "800-Meter Rule": The Blue Line Alpha

History (Red Line 2009) showed that properties within a 10-minute walk (800m) of a station outperformed the market by 25%. In 2026, the Blue Line is duplicating this.

  • The Anticipatory Surge: Areas like Mirdif City Centre Station and Academic City are seeing "Pre-Metro" price adjustments.
  • Investor Strategy: The "Best Deal" isn't buying where the Metro is now, but where the station box is currently being excavated. International City Phase 2 is being re-rated from "bus-dependent" to "Transit-Oriented," offering the highest potential for a 30% equity jump by 2029.

How to check Dubai Service Charge Index with the help of property heatmap?

A common 2026 mistake is ignoring the "Opex" (Operating Expense).

  • The Trap: A Business Bay tower might offer a 7% gross yield, but here is the reality, with service charges at AED 25/sq. ft., your net profit vanishes.
  • The Smart Play: Seek out "Square" or "Plaza" mid-rise buildings in Arjan or Town Square. These typically cap service charges at AED 8–12/sq. ft., protecting your monthly take-home pay.

Chiller-Free vs. District Cooling: The Secret to Higher Rental Income

Before buying, ask: "Is this building DEWA-only or District Cooling?"

District Cooling" (Empower/Emicool) actually demands charges that can eat 1% of your yield even when the unit is empty. For maximum yield, savvy investors are prioritizing "Chiller-Free" or DEWA-direct cooling systems in mid-market hubs.

Dubai Property Price Forecast is possible with the help of property heatmap?

Look for these "Triggers" to force a price re-evaluation:

  • School Completion: Communities like Dubai Hills Estate or Dubai South (GEMS Founders) see a 7% price jump the moment the school opens. Families move in, and supply dries up instantly.
  • The Handover Gap: Buying Ready-to-Move property in 2026 allows you to command a 15% rental premium over off-plan units, as tenants are tired of construction delays.

What are the challenges of using Dubai property heatmap in 2026?

The "Data Latency" Trap (The Mirror Effect)

The biggest misconception is that a heatmap shows you what is happening now. In reality, most heatmaps are built on historical DLD (Dubai Land Department) transaction data.

  • The Challenge: By the time an area turns "Red" (Hot) on your screen, the smart money has already exited. You are looking at a "mirror" of the past 3-6 months.
  • The Risk: If you buy into a "Red" zone today based on a heatmap, you might be buying at the peak of the cycle. You are essentially chasing a ghost of a price that was available six months ago.

2. The "Gross vs. Net" Distortion

A heatmap might show a community like JVC or Dubai South glowing with an 8.5% yield. This is almost always a Gross Yield calculation.

  • The Challenge: Heatmaps rarely account for the "invisible" yield-killers: District Cooling (Chiller) demand charges and Service Charge spikes.
  • The Reality: A "Hot" 8% gross yield area with a high service charge (AED 22/sq. ft.) is actually a "Cool" 5.5% net yield area. If the heatmap doesn't allow you to toggle "Net Yield," it is effectively a marketing tool, not an investment tool.

3. The "Zoning Overlap" Confusion

In 2026, Dubai Property Prices borders are shifting. As you noticed with the Wadi Al Safa 3 vs. 5 confusion, heatmaps often aggregate data by "Sector" rather than by "Project."

  • The Challenge: A heatmap might show an entire district as "High Growth," but that growth could be driven by a single premium master-developer (like Ellington or Sobha) while the rest of the district consists of low-quality, multi-developer plots.
  • The Risk: You buy a "Standard" building in a "Premium" colored zone, only to realize the secondary market doesn't treat them the same. You get the community's higher service charges but not the premium resale value.

4. The "Infrastructure Anticipation" Lag

Heatmaps love to highlight areas near the Metro Blue Line.

  • The Challenge: There is a massive gap between a "Proposed Station" and a "Functioning Station."
  • The Investor's Headache: In Dubai, a heatmap turns "Red" the moment a new Metro station is announced because investors start speculating and driving up the buying price. However, a tenant doesn't care about a "planned" station; they only pay a premium for a station they can actually use today.

Conclusion: How to Buy the 2026 Heatmap

To secure a "Best Deal," follow these tactical rules so that the best can be locked easily with attentive approach: - 

  • Exit Saturated Zones: If you hold assets in Downtown Dubai or Marina with 50%+ growth, 2026 is the year to rotate that capital into high-growth corridors like District 11 (MBR City) or Dubai South.
  • The "Airport Effect": Dubai South is transitioning from "Speculative" to "Corporate Hub." Pilots and logistics execs are signing multi-year contracts, reducing your "Vacancy Risk."
  • Target the "Sweet Spot": The highest investment safety in 2026 remains in the AED 1,300 – AED 1,700/sq. ft. range in infrastructure-linked hubs.

You can’t just close your eyes, pick a random apartment, and expect to get rich. In 2026, the real money isn't made by picking a "pretty" building; it’s made by picking a building that is connected to the city’s big projects. When you buy near a new Metro station or the massive new airport expansion, you aren't just buying four walls and a ceiling you are betting on the government's multi-billion dollar plan to grow the city.

Share Our Post

Frequently Asked Questions

Is Dubai property still a good investment in 2026 ?

Yes, but the strategy has shifted from "flipping" to "yield-holding." With 120,000 units arriving this year, profits are now found in infrastructure-linked areas (Blue Line/DWC) where rental demand remains higher than supply.

Which community has the highest rental ROI in Dubai right now ?

JVC (Jumeirah Village Circle) and DSO (Silicon Oasis) lead with 7.2% – 7.4% NET yields. While luxury areas like the Palm offer prestige, these mid-market hubs offer the best cash flow due to lower entry prices and managed service charges.

How much is the Metro Premium for properties near the Blue Line ?

Historically, properties within 800 meters of a station command a 20-25% higher valuation. In 2026, buying near the Blue Line "station boxes" in International City 2 or Mirdif is considered the top "capital growth" play.

What are the hidden costs of buying property in Dubai ?

Beyond the 4% DLD fee and 2% commission, the biggest "hidden" cost is the Service Charge. In 2026, these range from AED 12/sq. ft. in JVC to over AED 50/sq. ft. in Downtown luxury towers, which can slash your ROI by half.

Is it better to buy Ready or Off-Plan in 2026 ?

In 2026, Ready property is winning for immediate cash flow. Because many off-plan projects are facing "handover gaps," ready units allow you to capture the current high rents immediately without construction risk.

Does Dubai have property tax in 2026 ?

No. Dubai remains a 0% property tax and 0% capital gains tax jurisdiction. Your only major government cost is the one-time 4% Transfer Fee at the time of purchase.

What is the Chiller Trap for Dubai investors?

It refers to buildings with District Cooling (Empower/Emicool) where owners must pay high "demand charges" even if the apartment is empty. "Chiller-Free" (DEWA only) buildings are much more profitable for landlords in the long run.

You might also like
Dubai  Branded Residences To Rise 80% By 2030
Aishwarya
AishwaryaSenior Content WriterA Content Strategist, Crafting Data Driven & Impactful Content to Resonate with Audiences and Support Business.

Dubai Branded Residences To Rise 80% By 2030

Dubai Investment Park 2, DIP: A Complete Area Guide
Nisha Aggarwal
Nisha AggarwalContent WriterBinding words magically into effectual content.

Dubai Investment Park 2, DIP: A Complete Area Guide

Dubai Property Market Shows Better Results in August
Admin
AdminWriterAbout Author

Dubai Property Market Shows Better Results in August

Dubai Property Price Forecast 2024
Admin
AdminWriterAbout Author

Dubai Property Price Forecast 2024