Downtown Dubai vs Palm Jumeirah: Location, Investment & ROI Comparison (2026)

Downtown Dubai vs Palm Jumeirah: Location, Investment & ROI Comparison (2026)

  • Written byJaswinder Singh,Real Estate Expert
  • Buyer's Guide
  • Reviewed by Vikas Taneja, RERA Certified Broker, BRN 82127
  • Updated: 07 May 2026
  • 14 min read

Downtown Dubai trades at AED 2,959 to AED 2,977 per sqft. Palm Jumeirah trades at AED 3,830 per sqft for apartments and AED 6,428 per sqft for villas (DLD Q1 2026, Property Finder 2025). Downtown delivers 4 to 6% gross and 3.2 to 4.8% net yields. Palm delivers 5 to 5.5% gross and 3.5 to 4% net on apartments. Palm apartments recorded the strongest YoY price growth in Dubai at 31% to Q3 2025 (Knight Frank, Q3 2025). Two different products solving two different problems. Read this before you sign.

The honest answer is: it depends on the problem you are trying to solve. Downtown Dubai is an income and liquidity play built on a deep, transactable apartment market with strong corporate tenant demand. Palm Jumeirah is a capital preservation and scarcity play built on geographically constrained beachfront land with structurally limited supply. They look like alternatives. They are not.

In advisory work at Honey Money Real Estates, the most common buyer mistake on this comparison is asking which is “better” without first defining the goal. We see NRI buyers chase a Palm villa for the prestige, then panic when the net yield reads 3.5%. We see HNWI buyers buy a Downtown 1BR for capital growth, then watch a Shoreline apartment on the Palm appreciate 31% in twelve months while their Downtown unit moves 8 to 10%. Match the product to the goal. That is the entire decision.

Data in this guide is drawn from Dubai Land Department transaction records, the DLD Service Charge Index via Mollak, Property Finder rental listings, Knight Frank Q3 and Q4 2025 reports, Property Monitor Q1 2026 indices, Bayut listing data, Gulf News coverage, and DET short-term rental data. Where a figure could not be verified at time of publication, it is labelled as an estimate. Read this before you sign.

1. The Core Comparison: Two Different Products, Not Competitors

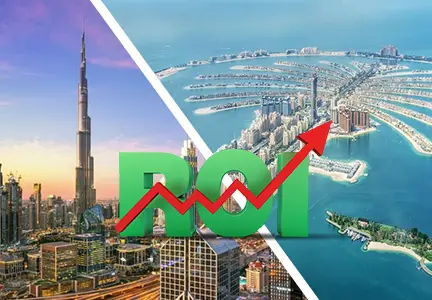
Downtown Dubai and Palm Jumeirah solve different investment problems. Downtown is a vertical, urban, high-density apartment market with deep transaction liquidity and a corporate tenant base. Palm Jumeirah is a low-density, geographically fixed waterfront market with structurally limited supply, branded residence trophy stock, and an international HNWI buyer base. Treating them as substitutes is the first mistake most buyers make.

What Downtown Dubai Is Optimised For

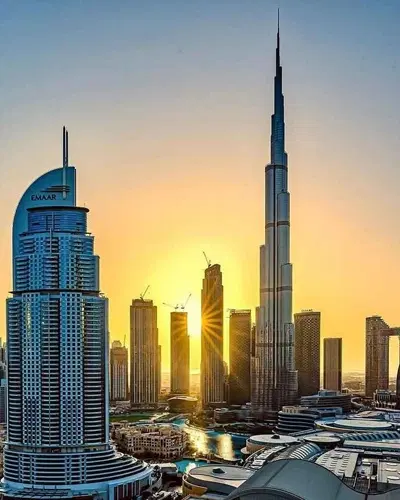
Downtown Dubai is the closest thing Dubai has to a global central business district address. The community is anchored by the Burj Khalifa, The Dubai Mall, the Dubai Opera District, and direct metro connectivity. Stock is overwhelmingly apartment, ranging from studios in Boulevard Central and Burj Vista to branded units in The Address Residences, Armani Hotel & Residences, IL Primo, and Opera Grand. The buyer base is split between corporate end-users, NRI rental investors, and HNWI penthouse buyers. Liquidity is the structural advantage. 1BR units in Burj Khalifa actively transact, and the average Burj Khalifa apartment listing sits at AED 348,109 per year (Bayut listing data, 2026).

What Palm Jumeirah Is Optimised For

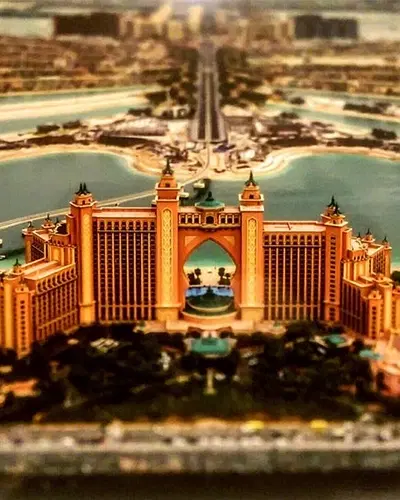
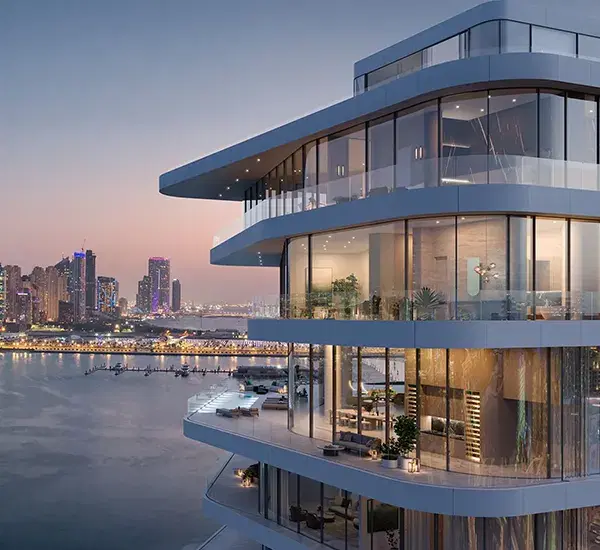
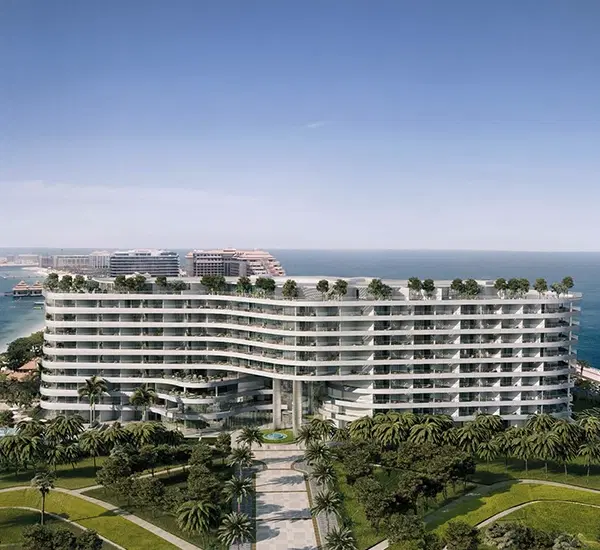
Palm Jumeirah is built on land reclamation completed in the mid-2000s. No further frond plots are buildable. The community comprises Trunk apartments (Shoreline, Golden Mile, Palm Tower), branded beachfront residences (Como, Six Senses, Armani Beach, One at Palm, LUCE by Taraf), and frond villas. Palm Jumeirah recorded AED 18.4 billion in total property transactions in 2024, and 1,229 resale transactions worth AED 12.1 billion in the 12 months to November 2025 (DLD records). The buyer base is dominated by international HNWIs treating the Palm as a Miami Star Island or Malibu equivalent trophy address. The Palm’s defining advantage is scarcity, not yield.

2. Price, Stock, and Liquidity: The Numbers Side by Side

On a per-square-foot basis Palm Jumeirah trades at a structural premium to Downtown. Roughly 30% higher for apartments and over 2x for villas. Liquidity, however, runs the opposite direction. Downtown’s apartment market clears more transactions per quarter, with shorter days-on-market for studios and 1BRs.

Indicative Price Map for Q1 2026

Metric

Downtown Dubai

Palm Jumeirah

Avg. price per sqft (apartments)

AED 2,959 to AED 2,977

Approx. AED 3,830

Avg. price per sqft (villas)

Not applicable (no villa stock)

Approx. AED 6,428

1BR apartment ticket size

AED 2.2M to AED 3.5M

AED 2.5M to AED 4M (Shoreline, Golden Mile)

Branded residence entry

AED 4M+ (Address, Armani Hotel)

AED 21.5M+ (Armani Beach, One at Palm)

Villa ticket (frond)

Not applicable

AED 24M to AED 216M (Frond J record, 2024)

12-month resale transactions

Deep apartment market, daily clearing

1,229 resales / AED 12.1B (Dec 2024 to Nov 2025)

Source: DLD records and Property Finder data, Q1 2026. Property Finder average for Palm apartments is 2025 dataset. Verify ticket size for any specific tower via DLD Sales Transaction Search before signing.

Liquidity: The Underrated Difference

Downtown’s liquidity is its quiet strength. A 1BR in Burj Khalifa, Burj Vista, or The Address Boulevard has a comparable transaction every week (Bayut data, 2026). Palm Jumeirah is liquid in absolute AED terms but thin in transaction count, particularly at the trophy end, where individual frond villa sales of AED 40M to AED 216M move the entire annual average. The data shows: if you may need to exit within 24 months, Downtown is the structurally safer bet.

3. Yields and Cash Flow: Gross, Net, and the Service Charge Reality

Headline gross yields favour Downtown apartments slightly, but the gap collapses once Mollak service charges are applied. The position reverses for Palm Jumeirah villas where absolute rental income outpaces the percentage yield. Gross yield is the wrong metric in both locations. Net yield is the only number that matters.

Gross vs Net Yields on Apartments and Villas

Yield Metric

Downtown Dubai

Palm Jumeirah

Apartment gross yield

4 to 6% (studios up to ~7.9%)

5 to 5.5% (studios up to ~6%)

Apartment net yield

3.2 to 4.8%

3.5 to 4.3%

Villa gross yield

Not applicable

3 to 4.5%

Villa net yield

Not applicable

Approx. 3.5 to 4%

Short-term rental ADR

Strong (Mall + Burj traffic)

AED 1,318, highest ADR in Dubai

Short-term gross yield potential

Mid to high single digits

8 to 12% (well-managed)

Source: Property Monitor Q1 2026, Knight Frank Q3 2025 and individual Palm investment guides. Palm ADR figure is Q3 2025. Verify your specific building’s rental performance via Property Finder transaction history and DET short-term rental permits before relying on yield estimates.

Service Charges: Where the Yield Actually Disappears

Mollak data shows Downtown carries a meaningfully heavier service charge burden than Palm Jumeirah for comparable apartment stock. The Burj Khalifa sits at approximately AED 67.88 per sqft, roughly 4.5x the Palm Shoreline range. Address-branded residences in Downtown run AED 55 to AED 65 per sqft. Palm Jumeirah Shoreline and Golden Mile apartments sit at a far lower AED 11 to AED 15 per sqft. Branded Palm residences (Armani Beach, One at Palm) push to AED 20 to AED 30+ per sqft. Frond villas run AED 8 to AED 15 per sqft. This is non-negotiable due diligence before you sign.

Building / Type

Service Charge (per sqft, p.a.)

Source Tier

Burj Khalifa

Approx. AED 67.88

Mollak Verified

The Address Residences (Downtown)

AED 55 to AED 65

Mollak Verified

Vida / Burj Vista

AED 21 to AED 39

Mollak Verified

Downtown community average

Approx. AED 21

DLD Service Charge Index

Palm Shoreline / Golden Mile

AED 11 to AED 15

Mollak Verified

Palm branded residences

AED 20 to AED 30+

Mollak Verified

Palm frond villas

AED 8 to AED 15

Mollak Verified

Source: Mollak Verified rates and DLD Service Charge Index, 2025 to 2026. Verify the exact approved rate for any specific tower or villa via the DLD Service Charge Index tool before purchase.

Do not accept verbal confirmation of service charges from any agent. Pull the Mollak record yourself. It is publicly accessible. The difference between AED 21 per sqft and AED 67 per sqft on a 1,100 sqft apartment is roughly AED 50,600 per year, which is the entire net yield differential between these two markets.

4. Capital Appreciation: The 5-Year Picture and What It Means for 2026

This is where the comparison flips. Palm Jumeirah apartments recorded the strongest YoY price growth of any Dubai community at 31% to Q3 2025, with 10-year villa case studies showing 118% appreciation (Knight Frank, Q3 2025). Downtown’s appreciation is real but more measured, tracking the citywide average of roughly 12.5% YoY (DLD, Q1 2026).

Why Palm Outperformed on Capital Growth

Three structural drivers. First, supply is fixed. Frond plots are exhausted, and new stock arrives only via demolition and rebuild or redevelopment. Second, the buyer base is international and dollar-strong, with Russian, British, GCC, Chinese, and Indian HNWI demand consistently outpacing supply. Third, branded residences (Como at AED 53.6M for a 4BR, One at Palm at AED 26.3M for a 3BR) created a new pricing tier that pulled the entire community up. Knight Frank’s 2026 Prime Global Cities Index ranks Dubai #2 globally behind Monaco. Palm Jumeirah is the asset that anchors that ranking.

Why Downtown’s Growth Is More Measured

Downtown has not stopped appreciating. It has simply matured. Stock is replenished through new towers in the Opera District and adjacent infill, which caps scarcity-driven price spikes. Demand is broader and more resilient (corporate tenants, end-users, NRI investors), but it is also more elastic to mortgage rates and macro conditions. The 2026 market signal is consistent: Downtown is up 5 to 10% YoY on apartments, with branded residence stock outperforming the community average.

Indicative 5-Year Capital Appreciation

Asset Class

Downtown Dubai

Palm Jumeirah

Standard apartments (5-yr)

30 to 45%

50 to 80%

Branded residences (5-yr)

40 to 60%

60 to 90%

YoY (most recent)

8 to 12%

31% apartments / 8% villa pricing

10-year villa benchmark

Not applicable

118% (case study, Knight Frank)

Source: Knight Frank Q3 2025, DLD records, Property Monitor DPI, 2026. Five-year ranges are indicative composite estimates. Verify specific building or villa appreciation via DLD Sales Transaction Search before relying on these figures for an investment decision.

5. Buyer Profiles: Who Should Buy Each, and Who Should Walk Away

This is the section the typical comparison blog avoids. Both addresses are excellent assets for the right buyer. The data shows that buying either for the wrong reason is the most expensive mistake in the Dubai market.

Buy Downtown Dubai if…

  • You are an income-focused investor seeking 4 to 5% net yields with deep resale liquidity and a corporate tenant base.
  • You are an end-user prioritising metro access, walkability to Dubai Mall and DIFC, and a vertical living lifestyle.
  • You are an NRI or first-time Dubai buyer entering at AED 2.2M to AED 3.5M for a 1BR with predictable rental clearing.
  • You may need to exit within 24 months and require a liquid asset, not a trophy.

Walk away from Downtown Dubai if…

  • You expect Palm-equivalent capital appreciation. The data does not support it.
  • You are buying in the Burj Khalifa for yield without modelling the AED 67.88 per sqft service charge. Your net yield will compress to 2.5% or below.
  • You want low-density beachfront or villa living. Downtown has neither.

Buy Palm Jumeirah if…

  • Your goal is capital preservation and prestige, with rental yield as a secondary consideration.
  • You are an HNWI or UHNWI seeking a globally-comparable trophy address (Como, Six Senses, Armani Beach, One at Palm).
  • You are an end-user prioritising low-density beachfront, private beach access, and resort amenities.
  • You can hold 5 to 10 years and benefit from structural supply scarcity.
  • You plan to operate a high-end short-term rental. The AED 1,318 ADR is the highest in Dubai (Knight Frank, Q3 2025).

Walk away from Palm Jumeirah if…

  • Your primary goal is current rental income. JVC, Dubai Hills, or Business Bay deliver 7 to 9% gross / 5%+ net at lower entry.
  • You may need to exit within 24 months and cannot absorb a liquidity discount on a trophy asset.
  • You are buying a frond villa without budgeting AED 8 to AED 15 per sqft service charges plus the salt-air maintenance load. Older Shoreline-era villas often need AED 2M to AED 5M of structural retrofit before they meet 2026 luxury standards.
  • You are stretching your equity to enter Palm. Buying a Palm property under-capitalised is the most common HNWI advisory mistake we see.

6. Side by Side Decision Table: Downtown Dubai vs Palm Jumeirah

This is the consolidated decision view. If your priority lines up with the left column, Downtown is the answer. If it lines up with the right, Palm Jumeirah is.

Investor Priority

Downtown Dubai

Palm Jumeirah

Maximum net rental yield

✅ 3.2 to 4.8% (apartments)

3.5 to 4.3% (apartments) / 3.5 to 4% (villas)

Capital appreciation potential (5-yr)

30 to 60%

✅ 50 to 90% (with scarcity premium)

Resale liquidity

✅ Daily clearing on 1BR/2BR

Slower at trophy tier, deep at Shoreline

Entry ticket (1BR)

✅ AED 2.2M to AED 3.5M

AED 2.5M to AED 4M

Service charge load

Heavy (AED 21 to AED 68 per sqft)

✅ Lighter (AED 11 to AED 30 per sqft)

Short-term rental ADR

Strong

✅ AED 1,318 (highest in Dubai)

Lifestyle: vertical urban

✅ Burj, Mall, Opera, metro

Limited

Lifestyle: low-density beachfront

Not available

✅ Defining feature

Trophy / branded residence stock

Strong (Address, Armani, IL Primo)

✅ Stronger (Como, Six Senses, One at Palm)

Suits buyer with 5+ year hold

✅✅

Suits buyer needing 24-month exit

Risk of liquidity discount

Golden Visa qualifying

✅ AED 2M+ threshold

✅ AED 2M+ threshold

Source: Composite from DLD records, Mollak Verified, Property Monitor DPI 2026, Knight Frank Q3 2025, Property Finder data. Ticks denote the address with the structural advantage on that priority. Verify specific tower or villa metrics via DLD before commitment.

7. Pre-Purchase Checklist: Non-Negotiable Due Diligence Before You Sign

Whichever address you choose, the same due diligence discipline applies. Read this before you sign.

  • Pull the Mollak service charge record for the specific building or villa. Do not accept the agent’s figure.
  • Verify the property is RERA-registered and the seller is the title-deed holder via DLD Sales Transaction Search.
  • Cross-check rental yield assumptions against the last 12 months of Ejari-registered transactions for the same building, not just listings.
  • If buying off-plan, confirm the project is in the RERA escrow account and check delivery track record. Timeline slippage is historically common.
  • For Palm villas, budget AED 2M to AED 5M for retrofit if the property is pre-2010 build. Salt-air corrosion and 2026 luxury-standard finishes require it.
  • For Downtown branded residences, calculate net yield using the actual Mollak rate (Burj Khalifa AED 67.88 per sqft is not a typo).
  • Confirm Golden Visa eligibility with ICP if the property is part of your residency strategy.
  • Engage a RERA-registered broker with Title Deed search authority (not just listing access). This is non-negotiable due diligence.
  • Budget 6 to 7% of property value in transaction costs (4% DLD transfer fee, 2% broker fee, registration, NOC, conveyancing).
  • If financing, secure pre-approval before signing the MoU. UAE mortgage rates track US Fed rates, currently elevated at 4.25%+.
Thinking About Investing in Dubai Property?

Frequently Asked Questions

Which is a better investment in 2026, Downtown Dubai or Palm Jumeirah?

Neither is universally better. Downtown Dubai is the better income asset, delivering 3.2 to 4.8% net yields on apartments with deep resale liquidity and an entry point of AED 2.2M to AED 3.5M for a 1BR (Property Finder data, 2026). Palm Jumeirah is the better capital appreciation asset, with apartments recording 31% YoY price growth to Q3 2025, the strongest in Dubai, anchored by structurally limited supply (Knight Frank, Q3 2025). The decision is goal-driven. Choose Downtown for cash flow and liquidity. Choose Palm for prestige, scarcity, and 5 to 10 year capital growth. Action: write your investment goal in one sentence before contacting an agent (yield, growth, end-use, or trophy). Match the address to the goal, not the goal to the address.

What is the actual net rental yield in Downtown Dubai vs Palm Jumeirah?

Downtown Dubai apartments deliver gross yields of 4 to 6% (studios up to ~7.9%), compressing to 3.2 to 4.8% net after service charges of AED 21 to AED 68 per sqft (Mollak Verified, 2026). Palm Jumeirah apartments deliver 5 to 5.5% gross / 3.5 to 4.3% net. Villas run 3 to 4.5% gross with significantly higher absolute rental income (AED 450,000 to AED 1.5M+ per villa per year). Palm’s short-term rental ADR of AED 1,318 is the highest in Dubai, allowing well-managed holiday-home operators to achieve 8 to 12% gross (Knight Frank, Q3 2025). Action: model net yield using the Mollak rate for your specific building, not the community average. Burj Khalifa at AED 67.88 per sqft and Address-branded residences at AED 55 to AED 65 per sqft will compress your headline yield by 1.5 to 2.5 percentage points.

How much capital growth has Palm Jumeirah delivered compared to Downtown Dubai?

Palm Jumeirah apartments led all Dubai communities at 31% YoY to Q3 2025, with frond villa case studies showing 118% over 10 years (AED 11M to AED 24M+). Downtown Dubai has appreciated more steadily, tracking the citywide 12.5% YoY average through Q1 2026 (DLD records). The structural reason is supply. Palm’s frond and trunk plots are exhausted, while Downtown continues to absorb new towers in the Opera District. Knight Frank’s 2026 Prime Global Cities Index ranks Dubai #2 globally behind Monaco, with Palm Jumeirah as the anchor asset. Action: if capital growth is your primary goal, allocate to Palm. If you need a balance of growth and liquidity, allocate to Downtown. Do not chase the 31% Palm headline without the holding-period and exit-liquidity discipline to back it.

Are service charges really that much higher in Downtown Dubai than Palm Jumeirah?

Yes. The Mollak Verified rates show a meaningful gap. Burj Khalifa sits at approximately AED 67.88 per sqft per year. Address-branded residences run AED 55 to AED 65 per sqft. Vida and Burj Vista sit at AED 21 to AED 39 per sqft. The Downtown community average is approximately AED 21 per sqft (Mollak Verified, 2026). Palm Jumeirah Shoreline and Golden Mile apartments are far lighter at AED 11 to AED 15 per sqft, with branded Palm residences at AED 20 to AED 30+ per sqft and frond villas at AED 8 to AED 15 per sqft. On a 1,100 sqft apartment, the difference between Downtown’s AED 21 per sqft community average and Burj Khalifa’s AED 67.88 per sqft is roughly AED 51,600 per year, which is the entire net yield differential between the two markets. Action: pull the Mollak record before signing. Do not accept verbal confirmation.

Which is better for an NRI buyer making their first Dubai purchase?

For most NRI first-time buyers with budgets between AED 2M and AED 5M, Downtown Dubai is the more disciplined entry. The reasoning is structural. An entry-tier 1BR in Burj Vista, Boulevard Central, or Vida Residences sits at AED 2.2M to AED 3.5M with predictable rental clearing of AED 155,000 to AED 230,000 per year (Bayut data, 2026), Golden Visa eligibility at the AED 2M+ threshold, and resale liquidity if your circumstances change. Palm Jumeirah at the same budget gets you a Shoreline 1BR. A perfectly valid asset, but with a thinner secondary market for that specific stock and limited capital growth at the non-branded entry tier. NRI buyers seeking trophy Palm exposure typically need AED 8M+ to access branded residences. Action: NRIs should match address to budget. Downtown at AED 2M to AED 5M, Palm at AED 8M+ for the prestige play to actually deliver.
Jaswinder Singh
Jaswinder Singh
Real Estate Expert

Jaswinder Singh is a Dubai Property Consultant at Honey Money Real Estates (ORN: 28658), with over a decade working exclusively across Dubai's freehold residential communities. Where most advisors stop at... Read More

Share Our Post