Dubai Real Estate Market Trends 2026: Prices, Data, Outlook

Dubai Real Estate Market Trends 2026: Prices, Data, Outlook

Dubai recorded AED 286.43 billion in property sales across 79,229 transactions in H1 2026 (DLD records, July 2026). Average residential prices reached AED 1,770 per sqft, up from AED 1,600 in 2025 (Property Finder DLD-sourced data, H1 2026), while off-plan captured roughly 71% of deals. Residential volumes cooled 13.8% against a record H1 2025. Read this before you sign.

Executive Summary

H1 2026 closed at AED 286.43 billion across 79,229 sales transactions (DLD records, July 2026), an average of 433 sales and AED 1.57 billion changing hands daily. January was the strongest single month in Dubai history at AED 72.16 billion from 15,896 deals (DLD records, 2026). Citywide pricing reached AED 1,770 per sqft, up from AED 1,600 across full-year 2025 (Property Finder DLD-sourced data, H1 2026), while off-plan held roughly 71% of transactions (Provident Estate DLD analysis, July 2026).

The nuance the headlines skip: residential volumes fell about 13.8% versus H1 2025 (Engel & Völkers DLD analysis, July 2026). Values held firm because buyers moved up the price curve, not because more deals closed. Looking ahead, Knight Frank forecasts prime price growth near 3% and mainstream growth near 1% for 2026, against a supply pipeline of up to 160,000 units (Knight Frank, Q4 2025).

1. Dubai Property Transactions: H1 2026 Volume and Value

Dubai closed the first half of 2026 with AED 286.43 billion in property sales through 79,229 transactions (DLD records, July 2026). It is the second-highest first half in the market's history. The data shows a market that is still moving serious volume, just at a calmer pace than the record run of 2025.

H1 2026 Headline Numbers

Indicator

H1 2026 Figure

Source

Total sales value

AED 286.43 billion

DLD records, July 2026

Sales transactions

79,229

DLD records, July 2026

Average daily activity

433 sales / AED 1.57 billion per day

DLD records, July 2026

Strongest month

January: AED 72.16 billion, 15,896 deals

DLD records, 2026

June rebound

13,766 sales worth AED 32.66 billion

DLD records, July 2026

Source: Dubai Land Department data reported July 2026. Verify individual transaction records via the DLD open data portal before relying on area-level figures.

The Honest Comparison vs H1 2025

Residential-only analysis tells a more measured story. Dubai logged about 79,281 residential sales worth AED 221.4 billion in H1 2026, against 91,973 sales worth AED 262.6 billion in H1 2025. That is a 13.8% drop in volume and 15.7% in value (Engel & Völkers DLD analysis, July 2026).

Two things are true at once. Total market value stayed near record territory because average tickets grew, while the number of residential deals cooled off an exceptional 2025 base. Portals rarely separate the two. The data shows moderation in count, not a price collapse. For context on the run-up that preceded this, see our guide on why property prices are increasing in Dubai.

One definitional trap to avoid: DLD's Q1 2026 release cited AED 252 billion across 60,303 "transactions," which includes mortgages and gifts, while pure sales in Q1 were roughly AED 138.7 billion across 44,150 deals (DLD records, Q1 2026). Comparing one against the other produces false growth claims. Do not accept verbal confirmation of market statistics without the underlying dataset definition.


2. Dubai Property Prices 2026: Movement by Segment

Pricing kept climbing in H1 2026 even as deal count moderated. The average price paid per property reached AED 3.7 million, versus AED 3.2 million across full-year 2025, and citywide pricing rose to AED 1,770 per sqft from AED 1,600 (Property Finder DLD-sourced data, H1 2026).

Price Indicators: 2025 vs H1 2026

Metric

2025 (Full Year)

H1 2026

Source

Average price per sqft (citywide)

AED 1,600

AED 1,770

Property Finder DLD-sourced data, 2026

January snapshot per sqft

AED 1,674 (Jan 2025)

AED 1,976 (Jan 2026, +18% YoY)

DXB Analytics DLD data, March 2026

Average ticket per property

AED 3.2 million

AED 3.7 million

Property Finder DLD-sourced data, 2026

Prime values per sqft

Rising through 2025

Above AED 4,300

Knight Frank, Q4 2025

Source: DLD transaction data via Property Finder, DXB Analytics and Knight Frank, 2025 to H1 2026. Verify per-sqft pricing for a specific building via recent DLD transactions before making an offer.

Where the Volume Sits by Price Band

The AED 1 million to AED 2 million band captured about 32% of H1 2026 activity, the largest single share. Entry-level deals below AED 1 million took 28.7%, and transactions above AED 5 million held 11.2% (Provident Estate DLD analysis, July 2026). The mid-market drives volume; the premium end drives value growth.

Segment divergence is now the defining trend. Knight Frank recorded 500 sales above USD 10 million in 2025, up from just 30 in 2020, with the USD 25 million-plus bracket jumping 45% year on year (Knight Frank, Q4 2025). Mainstream stock in heavily supplied districts faces flatter pricing and longer selling periods.

3. Top Performing Areas in Dubai Real Estate

Location performance split sharply in H1 2026. Established, connected communities kept absorbing demand, while oversupplied pockets saw pricing competition. In the secondary apartment market, three districts dominated volume.

Top Secondary Apartment Areas: H1 2026

Area (DLD zone)

Share of Secondary Apartment Volume

Source

Al Barsha South Fourth (JVC)

10.6%

Provident Estate DLD analysis, July 2026

Business Bay

8.5%

Provident Estate DLD analysis, July 2026

Marsa Dubai (Dubai Marina)

7.9%

Provident Estate DLD analysis, July 2026

Source: DLD secondary market transactions via Provident Estate, H1 2026. Verify current listing depth and days-on-market for your target building via Property Finder data before pricing an offer.

Jumeirah Village Circle keeps leading on volume because it pairs sub-AED 1 million entry pricing with strong tenant demand. Dubai Marina remains the most liquid resale market for waterfront apartments. On the growth frontier, DLD transaction data through early 2026 shows the strongest appreciation in the southern corridor: Dubai South, Jabal Ali and Nadd Hessa, driven by Al Maktoum airport investment (DXB Analytics DLD data, 2026).

4. Off-Plan vs Ready Property: Where the Money Went

Off-plan is still where the majority of money went. Off-plan properties accounted for roughly 71% of total transactions in H1 2026 (Provident Estate DLD analysis, July 2026), and close to three quarters of residential sales value in Q1 (DLD records, Q1 2026). Payment plans and lower entry pricing keep pulling investors forward.

The ready market is not the loser in this story. Secondary deals attracted end-users who want immediate occupancy and proven rental income, and mortgage activity backs that up: about 10,800 residential mortgage transactions were registered in Q1 2026, up 16.1% year on year (Cavendish Maxwell, Q1 2026). DLD-registered mortgage value hit AED 9.02 billion in April alone (Property Finder data, 2026). Our breakdown of off-plan property in Dubai covers payment structures in detail.

The buyer profile shifted decisively toward end-users. More than 85% of early-2026 transactions were led by owner-occupiers, and 88% of Mortgage Finder clients were buying homes to live in (Property Finder data, 2026). This is not the speculative churn of earlier cycles. It is a slower, stickier kind of demand.

Off-Plan Delivery Risk: The Number That Matters

Only 64% of homes scheduled for delivery in 2025 completed on time (Knight Frank, Q4 2025). Timeline slippage is historically common. If your payment plan or rental assumptions depend on a handover date, checking the developer's completion track record and escrow status via RERA records is non-negotiable due diligence.

5. Dubai Rental Market 2026: Rents, Yields, Smart Rental Index

Rents kept rising into 2026, though at a slower rate than the 2022 to 2024 surge. Average rents rose about 5% to 8% across Dubai in 2025, and those gains were baked into the updated index benchmarks (RERA Smart Rental Index revisions, 2026). Rental contract volumes rose 16% year on year by April 2026 as tenant movement resumed (Property Finder data, 2026).

Rental Market Indicators: 2026

Indicator

Latest Reading

Source

Average rent growth, 2025

+5% to +8% across communities

RERA Smart Rental Index revisions, 2026

Rental contract volumes

+16% year on year (April 2026)

Property Finder data, 2026

Citywide gross apartment yield

Approx. 7.0% (2025 reading)

Estimate — verify before relying on this figure

Highest-yield districts

International City approx. 8.9%; Dubai Silicon Oasis approx. 8.5%

DLD-sourced market analysis, April 2026

Source: RERA Smart Rental Index and Property Finder data, 2025 to 2026. Verify the permitted rent for any specific unit via the RERA rental calculator on the DLD app before renewing or pricing a lease.

Smart Rental Index: The Rule Change Shaping 2026

The DLD's Smart Rental Index now benchmarks fair rent at building level using live Ejari transaction data and building quality ratings, replacing broad community averages (DLD, 2026). Renewal increases remain capped under Decree No. 43 of 2013: a maximum 20% rise applies only when the current rent sits more than 40% below the indexed benchmark, with smaller bands of 5% to 15% for narrower gaps, and 90 days' written notice is mandatory (RERA records).

For landlords, the practical effect is that building ratings now influence achievable rent, so maintenance has a measurable return. For tenants, an increase notice that ignores the index is challengeable at the Rent Disputes Settlement Centre. Do not accept verbal confirmation of a permitted increase; run the Ejari number through the RERA calculator yourself.

6. Buyer Nationality and Investor Data

Foreign capital did the heavy lifting again. Foreign investment reached AED 148.35 billion in Q1 2026 alone, up 26% year on year, across 48,445 foreign investments (DLD records, Q1 2026). The market added 29,312 new investors in the quarter, a 14% increase, and women investors accounted for 15,540 transactions worth AED 32 billion (DLD records, Q1 2026).

Q1 2026 Investor Snapshot

Investor Metric

Q1 2026

Change YoY

Source

Foreign investment value

AED 148.35 billion

+26%

DLD records, Q1 2026

Foreign investments (count)

48,445

+11%

DLD records, Q1 2026

New investors

29,312

+14%

DLD records, Q1 2026

GCC national investment

AED 12.23 billion

+14%

DLD records, Q1 2026

Women investors

15,540 deals / AED 32 billion

Not disclosed

DLD records, Q1 2026

Source: Dubai Land Department Q1 2026 release via Dubai Media Office. Verify nationality-level breakdowns via DLD annual reporting before citing them in investment documents.

On nationality, British buyers took the top spot in spring 2026, ahead of Indian, Australian and Egyptian buyers (Betterhomes data, March to April 2026). The wealth migration backdrop supports this: Dubai counted more than 30,000 resident HNWIs in 2025, up 25% over five years, with over 100,000 millionaires projected by 2027 (Knight Frank Wealth Report, 2026). Dubai also led the world with 500 home sales above USD 10 million in 2025 (Knight Frank, Q4 2025).

7. Policy and Regulation: What Changed in 2026

Three regulatory shifts are actively reshaping behaviour in 2026, and each one changes a number you should check before transacting.

Building-Level Rent Regulation

The Smart Rental Index, covered in Section 5, moved rent regulation from community averages to unit-level benchmarks using AI and live Ejari data (DLD, 2026). It is the single biggest change to landlord-tenant economics since Decree 43 of 2013.

Golden Visa Demand at AED 2 Million

The AED 2 million property threshold for the 10-year Golden Visa continues to concentrate demand around that price point, converting long-term renters into owners and anchoring the mid-premium segment (UAE Government portal). This structural demand is one reason the AED 1 million to AED 2 million band leads transaction volume.

Population and the 2040 Plan

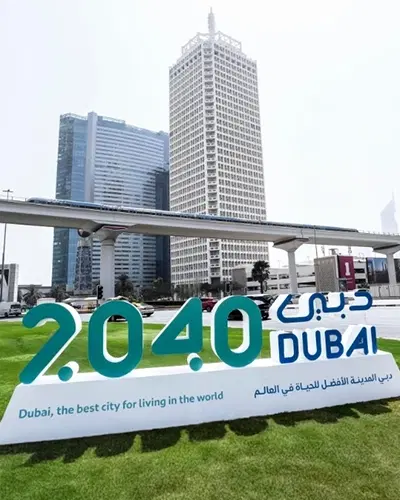
Dubai's population crossed the 4 million mark on 28 August 2025 (Dubai Statistics Centre) after adding more than 208,000 residents in 2024, a 5.5% annual increase. The Dubai 2040 Urban Master Plan targets 5.8 million residents, and current growth is running ahead of that trajectory. Housing demand is a direct function of this curve.

Regulatory oversight also tightened in practical terms: escrow accounts, construction-linked payment disbursement and ongoing RERA project monitoring now frame every off-plan purchase (RERA records). These protections only work if you use them. Confirm the project's escrow account number on your booking form before transferring any deposit.

8. Dubai Real Estate Outlook: H2 2026 and 2027

The base case for the rest of 2026 is selective, slower growth rather than a citywide swing in either direction. Knight Frank forecasts prime residential prices to rise about 3% in 2026 with mainstream growth averaging near 1% (Knight Frank, Q4 2025). The variable to watch is supply.

The Supply Question

Up to 160,000 residential units could enter the market in 2026, with apartments making up about 85% of that pipeline (Knight Frank, Q4 2025). History argues for a discount on that headline: long-term on-time delivery runs well below pipeline projections, and Knight Frank's realistic scenario assumes roughly 66,000 completions per year through 2030. Where supply concentrates, mainstream apartment pricing will feel it first.

What This Means by Buyer Type

  • Buy if you are an end-user with a 5-year-plus horizon in an established community, or a yield investor targeting high-demand districts like JVC and Business Bay at verified net yields.
  • Negotiate hard if you are buying mainstream off-plan in a heavily supplied corridor. The 2026 pipeline gives you leverage that 2024 buyers never had.
  • Walk away if the deal only works with uninterrupted price growth, an on-time handover and top-of-range rent. All three held in 2025. Betting on all three for 2027 is speculation, not investing.

Structurally, this is a market Knight Frank now classifies as "emerged" rather than emerging: end-user driven, regulated, and less prone to the boom-bust pattern of earlier cycles (Knight Frank, Q4 2025). Moderating volumes against record values is what maturity looks like in the data. Read this before you sign.

Thinking About Investing in Dubai Property?

Frequently Asked Questions

What are the current Dubai real estate market trends in 2026?

Dubai real estate market trends in 2026 show record values with cooling volumes: AED 286.43 billion in H1 sales across 79,229 transactions (DLD records, July 2026), with off-plan at roughly 71% of deals. Track quarterly DLD releases rather than portal headlines before deciding.

Are Dubai property prices rising or falling in 2026?

Dubai property prices are still rising in 2026, but selectively. Citywide averages reached AED 1,770 per sqft in H1 2026 versus AED 1,600 in 2025 (Property Finder DLD-sourced data). Prime is outpacing mainstream, so verify recent per-sqft transactions for your specific building before offering.

Is off-plan still dominating Dubai property sales?

Yes. Off-plan properties captured about 71% of Dubai transactions in H1 2026 (Provident Estate DLD analysis, July 2026), backed by payment plans and lower entry pricing. Only 64% of 2025 deliveries completed on time (Knight Frank, Q4 2025), so check the developer's delivery record and escrow status first.

Which areas in Dubai recorded the most sales in 2026?

Jumeirah Village Circle led secondary apartment volume with 10.6% of H1 2026 deals, followed by Business Bay at 8.5% and Dubai Marina at 7.9% (Provident Estate DLD analysis, July 2026). Compare yields and service charges across all three before choosing where to buy.

Will Dubai property prices drop in 2027?

A broad drop is not the base case. Knight Frank projects about 3% prime and 1% mainstream growth for 2026, with up to 160,000 units in the pipeline (Knight Frank, Q4 2025). Oversupplied mainstream pockets may flatten, so stress-test any purchase against zero price growth before committing.
Kamal Garg
Kamal Garg
Dubai Property Consultant

Kamal Garg is a Dubai Property Consultant at Honey Money Real Estates (ORN: 28658), with over 8 years of experience building investor portfolios across the UAE and South Asian markets.... Read More

Share Our Post

Related Projects

Binghatti Amber Studio & Apartments at JVC

Binghatti Amber Studio & Apartments at JVC

BINGHATTI
0.57M*
Studio, 1, 2 & 3 BR
358 - 2,355 Sq. Ft.
Apartments
Binghatti Wraith at Al Jaddaf Dubai

Binghatti Wraith at Al Jaddaf Dubai

BINGHATTI
0.799M*
Studio, 1, 2 & 3 BR
341 - 2,574 Sq. Ft.
Apartments
Emaar Serro Villas at The Heights Country Club & Wellness

Emaar Serro Villas at The Heights Country Club & Wellness

EMAAR
6.5M*
3, 4 & 5 BR
3,340 - 5,884 Sq. Ft.
Villas
Nshama Address Grand Downtown Dubai

Nshama Address Grand Downtown Dubai

NSHAMA Developer
11.08M*
3, 4 & 5 BR
4,106 - 11,093 Sq. Ft.
Apartments & Duplexes
Sobha Marina at Dubai Marina

Sobha Marina at Dubai Marina

SOBHA Realty
On Request
1, 2 & 3 BR
Coming Soon
Apartments