Luxury vs Affordable Property in Dubai 2026: Which Is Better for Investors?

Luxury vs Affordable Property in Dubai 2026: Which Is Better for Investors?

  • Written byKamal Garg,Dubai Property Consultant
  • Buyer's Guide
  • Reviewed by Vikas Taneja, RERA Certified Broker, BRN 82127
  • Updated: 01 Jun 2026
  • 20 min read

Luxury Dubai property (Palm Jumeirah, Downtown, Emirates Hills) delivered 13 to 15 percent annual capital appreciation in 2024 to 2025 (DLD records) but yields just 3 to 5.5 percent gross. Affordable property (JVC, Dubai South, International City) pays 7 to 10 percent gross yields with weaker capital growth. Q1 2026 Dubai recorded AED 142.3 billion in residential sales, with off-plan at 70 percent of value. Read this before you sign.

The honest answer is: neither segment is universally better. Luxury wins on capital growth, brand resilience, and Golden Visa qualification on a single asset. Affordable wins on cash flow, secondary market liquidity, and lower entry tickets. The right choice depends on your hold period, whether you need monthly income or wealth accumulation, and how much capital you can lock up for 5 to 10 years.

From our advisory work at Honey Money Real Estates, the most common buyer mistake is comparing the wrong numbers. Investors look at a 9 percent gross yield in International City and a 4 percent gross yield on Palm Jumeirah and call it an obvious win for International City. They forget to compare total return after service charges, vacancy, and capital growth. They also forget that exit liquidity in branded Downtown stock can be 4 to 8 weeks; in some affordable supply-heavy towers, the same exit takes 6 to 12 months. The yield gap is real. The full return picture is rarely as wide as it looks.

Data sources used in this article: Dubai Land Department transaction records and Rental Index Q1 2026, RERA Mollak service charge filings, Ejari tenancy data, Property Finder and Bayut listing data, Knight Frank Dubai Residential Reports, Cavendish Maxwell quarterly data, Betterhomes branded residence research, JLL UAE Living, and Gulf News. Read this before you sign.

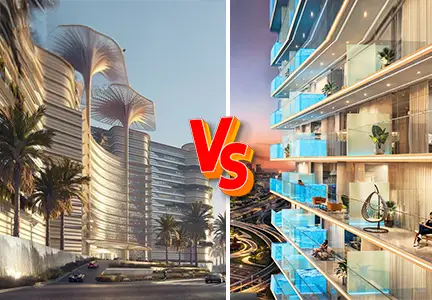
1. Luxury vs Affordable Dubai Real Estate by Price Per Sq Ft

Most online comparisons skip a basic step: defining the segments. Without clear price bands, the conversation drifts into opinion. In Dubai 2026, DLD transaction data lets us draw the lines cleanly.

Segment

Price per Sqft (2026)

Representative Communities

Typical 1BR Ticket (AED)

Affordable

AED 850 to 1,400

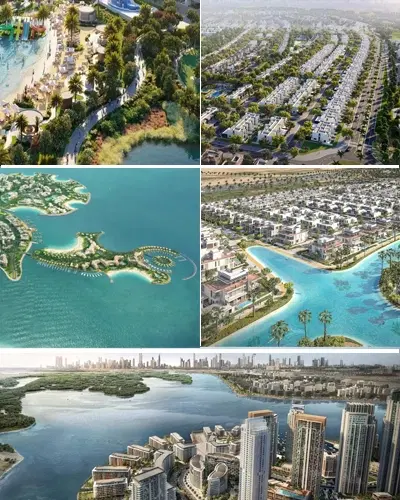
International City, JVC, Dubai South, Arjan, Discovery Gardens

450,000 to 1,100,000

Mid-market

AED 1,400 to 2,000

Business Bay, JLT, Dubai Marina (older), Al Furjan

1,100,000 to 2,200,000

Premium

AED 2,000 to 3,500

Downtown Dubai, Dubai Hills, Dubai Creek Harbour

2,200,000 to 4,500,000

Luxury

AED 3,500 to 7,000

Palm Jumeirah, Bluewaters, Madinat Jumeirah Living

4,500,000 to 12,000,000

Ultra-luxury

AED 7,000 plus

Jumeirah Bay Island, Emirates Hills, branded residences

12,000,000 plus

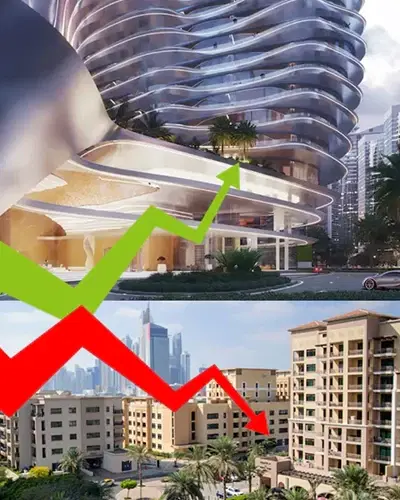
Source: DLD transaction records, Property Finder data, Bayut data, Q1 2026. Average price per sqft citywide reached AED 1,759 in Q1 2026, up 12.5 percent year-on-year (DLD records).

This is non-negotiable due diligence. When a portal advertises a property as luxury, check the actual price per sqft against this table. Marketing language is not the same as a price band. A AED 1.5 million Dubai Marina 1BR is mid-market by price, not luxury.

2. Dubai Rental Yield Gap: Gross vs Net Returns by Property Segment

Portals quote gross yield. The number that lands in your bank account is net yield. Across the four Dubai segments, the gap between gross and net widens as you move up-market because service charges scale faster than rent.

Gross Yield by Segment, Q1 2026

Segment

Gross Yield Range

Indicative Net Yield

Yield Compression

Affordable (JVC, Dubai South, Int. City)

7.0 to 10.0 percent

5.2 to 7.5 percent

1.5 to 2.5 pp

Mid-market (Business Bay, JLT)

5.5 to 7.5 percent

3.8 to 5.5 percent

1.7 to 2.0 pp

Premium (Downtown, Dubai Hills)

4.5 to 6.5 percent

2.8 to 4.2 percent

1.7 to 2.3 pp

Luxury (Palm Jumeirah, Bluewaters)

4.0 to 5.5 percent

2.5 to 3.8 percent

1.5 to 1.7 pp

Ultra-luxury (branded residences)

3.0 to 5.5 percent

1.5 to 3.5 percent

1.5 to 2.0 pp

Source: DLD Rental Index Q1 2026, Mollak service charge filings, Property Finder data. Net yield assumptions: deduct service charges, 5 to 8 percent vacancy reserve, 1 percent annual maintenance, and 6 to 8 percent property management fee if used. Mortgage interest not deducted.

Why the Net Compression Differs

Service charges in JVC sit at AED 8 to 14 per sqft per year. In Downtown Dubai branded stock, they reach AED 40 to 68 per sqft. The Burj Khalifa is reported around AED 67.88 per sqft (Luxhabitat service charge guide, April 2026). A 1,000 sqft unit in JVC pays AED 8,000 to 14,000 per year. The same size unit in Burj Khalifa pays close to AED 68,000. Both buildings see similar percentage rent growth, but the absolute service charge gap absorbs a much larger slice of luxury rent.

The data shows headline yields hide the real spread. Affordable property out-yields luxury by 3 to 5 gross percentage points but by only 2.5 to 4 net percentage points. The gap is real, just smaller than portal numbers suggest.

3. Capital Appreciation: Five-Year Track Record by Segment

This is where luxury closes the gap and often overtakes affordable on total return. Capital growth from 2020 to early 2026 has been uneven across segments.

Segment

5-Year Price Growth (2020 to 2026)

2024 to 2025 YoY Growth

2026 Forecast

Affordable (JVC)

Approx 75 percent (AED 660 to over 1,150 per sqft)

8 to 12 percent

2 to 7 percent

Mid-market (Business Bay, JLT)

55 to 70 percent

10 to 14 percent

5 to 8 percent

Premium (Downtown)

70 to 95 percent (AED 1,800 to 2,980 per sqft)

12 to 18 percent

6 to 10 percent

Luxury (Palm Jumeirah villas)

100 to 140 percent (sustained scarcity premium)

14 to 22 percent

6 to 10 percent

Ultra-luxury (branded)

Approx 40 percent premium per sqft vs non-branded

10 to 15 percent

3 to 5 percent (selective)

Source: DLD transaction records, Cavendish Maxwell, Knight Frank, Betterhomes branded residences report 2025. Dubai citywide growth between 2020 and 2026 was approximately 57.9 percent (DXB Interact analytics). JVC outperformed the citywide average.

The Total Return Comparison That Most Articles Skip

Yield alone is not return. Total annualised return equals net yield plus capital appreciation. Over a 5-year hold, the segments converge more than the yield gap suggests.

Segment

Avg Net Yield (Annual)

Avg Annual Appreciation (2020 to 2026)

Approx Total Annual Return

Affordable (JVC)

5.8 percent

11.8 percent

17.6 percent

Mid-market (Business Bay)

4.5 percent

10.5 percent

15.0 percent

Premium (Downtown)

3.5 percent

13.5 percent

17.0 percent

Luxury (Palm villas)

3.2 percent

16.5 percent

19.7 percent

Ultra-luxury (branded)

2.5 percent

10.5 percent (forward 3 to 5 pct)

13.0 percent (volatile)

Source: Composite of DLD records, Cavendish Maxwell, JLL, and Knight Frank, 2020 to Q1 2026. Past performance is not a guarantee of future returns. 2026 forecasts indicate growth moderation across all segments.

The honest takeaway: luxury and affordable both delivered double-digit total returns in the 2020 to 2026 cycle. Affordable carried more of its return in cash flow. Luxury carried more in capital. Net of taxes and friction, the two segments were closer than the yield headlines imply.

4. Dubai Service Charges and Hidden Costs: What Property Buyers Must Know

Every Dubai investment article mentions service charges. Few break out the full ownership cost stack. This is one of the gaps in the current online content.

Service Charge Range by Community, 2026

Community

Service Charge (AED per sqft per year)

Annual Charge on 1,000 sqft

International City

7 to 10

7,000 to 10,000

JVC

8 to 14

8,000 to 14,000

Arjan

10 to 14

10,000 to 14,000

Dubai South

8 to 12

8,000 to 12,000

Al Furjan

10 to 14

10,000 to 14,000

JLT

13 to 20

13,000 to 20,000

Dubai Marina

14 to 22

14,000 to 22,000

Business Bay

15 to 22

15,000 to 22,000

Downtown Dubai (average)

17 to 40

17,000 to 40,000

Palm Jumeirah (standard apartments)

11 to 15

11,000 to 15,000

Palm Jumeirah (signature villas)

20 to 25

20,000 to 25,000

Burj Khalifa

Approx 68

Approx 68,000

Branded residences (Address, Armani)

55 to 68

55,000 to 68,000

Source: Mollak service charge filings, Luxhabitat Dubai Service Charges Guide April 2026, PropertyWiki area data. Verify the exact tower-level charge via the Mollak portal or DLD Service Charge Index before purchase.

The Full Ownership Cost Stack Most Buyers Miss

  • DLD transfer fee: 4 percent of property value, paid once at registration.
  • Trustee fee: AED 4,000 plus 5 percent VAT, at transfer.
  • Title deed issuance: AED 580.
  • Property management fee (if used): 5 to 8 percent of annual rent.
  • Short-term rental management (Holiday Home): 15 to 25 percent of revenue, plus DET licensing of AED 1,520 plus per-room fees.
  • Vacancy reserve: 5 to 8 percent of annual rent as a planning buffer.
  • District cooling capacity charge: AED 600 to 1,000 per cooling ton per year for the landlord in Marina, JLT, Business Bay, and Palm Jumeirah apartments.
  • Maintenance reserve: 0.5 to 1 percent of property value per year.
  • Mortgage registration: 0.25 percent of loan plus AED 290.

Do not accept verbal confirmation on any of these costs. Service charges shift annually. District cooling capacity charges in branded towers can exceed AED 15,000 per year for a 2BR unit alone. Get the latest Mollak filing for the specific tower before signing.

5. Exit Liquidity: Time on Market by Segment

Almost no online article covers this. Yield and growth matter only if you can exit at a fair price when you need to. Time on market varies sharply across Dubai segments and is one of the most under-discussed risks in mid-market and ultra-luxury alike.

Indicative Time on Market by Segment, 2026

Segment

Median Time to Sell

Liquidity Risk

Affordable (JVC, Dubai South, prime towers)

30 to 60 days

Low to moderate

Affordable (supply-heavy newer towers)

90 to 180 days

Moderate to high

Mid-market (Business Bay, JLT)

45 to 90 days

Moderate

Premium (Downtown core)

30 to 75 days

Low

Luxury (Palm Jumeirah signature villas)

60 to 150 days

Moderate

Ultra-luxury (Jumeirah Bay, branded)

120 to 365 days plus

High

Source: Property Finder listing analytics and Bayut data, Q1 to Q2 2026. Time to sell varies by tower, view, layout, and asking discipline. Verify comparable resale timelines in the specific building before committing to an exit window.

Why Affordable Can Be Less Liquid Than You Think

Premium Downtown stock has tight float and global demand. Buyers wait for the right unit. Affordable supply-heavy JVC towers at handover can have 50 to 200 competing resale listings at any time, dragging time on market to 4 to 6 months. Liquidity in the affordable segment is concentrated in proven towers with limited investor concentration. The data shows building selection matters as much as community selection.

6. Same-Budget Scenarios: AED 2M, AED 5M, and AED 15M Compared

This is the comparison most online guides avoid because it requires running real numbers. Below are three same-budget scenarios using verified 2026 indicative pricing.

Scenario A: AED 2 Million Budget (Golden Visa Threshold)

Option

Option 1: Two JVC 1BRs

Option 2: One Business Bay 1BR

Option 3: One Palm Jumeirah studio

Capital deployed

AED 2,000,000 (AED 1M each)

AED 2,000,000

AED 2,000,000 (approx 425 sqft)

Approx gross annual rent

Approx AED 160,000 combined

Approx AED 120,000

Approx AED 90,000

Gross yield

8.0 percent

6.0 percent

4.5 percent

Service charges (annual)

Approx AED 18,000 combined

Approx AED 13,500

Approx AED 6,000

Indicative net yield

5.8 to 6.5 percent

4.0 to 4.6 percent

2.8 to 3.5 percent

Capital growth expectation 2026

2 to 7 percent

4 to 8 percent

5 to 9 percent

Exit liquidity

Moderate (building dependent)

Moderate

Strong for the right view

Golden Visa qualification

Yes (aggregate value)

Yes (single asset)

Yes (single asset)

Source: Property Finder and Bayut indicative pricing Q1 to Q2 2026, DLD Rental Index, Mollak filings. Figures are indicative and tower-specific verification is required before purchase.

Scenario B: AED 5 Million Budget

Option

Option 1: Diversified 3-unit JVC portfolio

Option 2: One Downtown 2BR fountain view

Option 3: One Dubai Hills villa (3BR)

Capital deployed

AED 5,000,000 (3 units approx AED 1.65M each)

AED 5,000,000

AED 5,000,000

Approx gross annual rent

Approx AED 360,000

Approx AED 280,000

Approx AED 250,000

Gross yield

7.2 percent

5.6 percent

5.0 percent

Indicative net yield

5.4 percent

3.6 percent

3.8 percent

Capital growth expectation 2026

2 to 7 percent

6 to 10 percent

8 to 12 percent

Vacancy risk

Diversified across 3 tenants

Single tenant

Single tenant

Exit liquidity

Moderate (3 separate exits)

Strong

Strong for villa stock

Source: DLD records, Property Finder data, Bayut data, Q1 to Q2 2026. Villa median resale price was AED 4.3 million in Q1 2026, up 16.2 percent year-on-year (DLD records).

Scenario C: AED 15 Million Budget

Option

Option 1: Palm Jumeirah signature villa

Option 2: Branded residence (Bulgari, Armani, One)

Option 3: 8 to 10 affordable units portfolio

Capital deployed

AED 15,000,000

AED 15,000,000

AED 15,000,000 (mixed JVC and Dubai South)

Approx gross annual rent

Approx AED 750,000

Approx AED 600,000 to 700,000

Approx AED 1,200,000

Gross yield

5.0 percent

4.0 to 4.6 percent

8.0 percent

Indicative net yield

3.5 percent

2.0 to 2.8 percent

5.8 percent

Capital growth expectation 2026

6 to 10 percent

3 to 5 percent (selective)

2 to 7 percent

Management complexity

Low (single asset)

Low (single asset, often hotel-serviced)

High (8 to 10 tenants, multiple managers)

Status / prestige value

High

Very high

Low

Source: DLD records, Knight Frank Dubai 2026, Betterhomes branded residences research 2025. Branded residences command an approximate 40 percent price premium per sqft over non-branded equivalents (Betterhomes report 2025).

Match the product to the goal. AED 2M scenarios show the cleanest yield-versus-prestige trade-off. AED 5M shows where capital growth starts to dominate. AED 15M is where status and management simplicity become as important as return.

7. Tenant Profile, Vacancy Risk, and Rental Stability

Yield numbers ignore who is paying the rent. Tenant profile drives vacancy, renewal rates, and how aggressively you can push rent at the annual review.

Segment

Typical Tenant Profile

Avg Lease Length

Vacancy Risk

Affordable

Single professionals, junior expat staff, mid-income families, blue-collar workers (Int. City)

12 months, frequent turnover

Moderate (5 to 8 weeks between tenants)

Mid-market

Mid-career expats, DMCC and Business Bay company staff, young couples

12 to 24 months, moderate turnover

Low to moderate (4 to 6 weeks)

Premium

Senior expat executives, end-user owners, occasional short-term rental

12 to 36 months, low turnover

Low (2 to 4 weeks if priced right)

Luxury

C-suite expats, HNW residents, family offices, lifestyle owners

24 to 36 months when leased, often owner-occupied

Low when occupied, but slow re-let if vacated

Ultra-luxury

UHNW global owners, often owner-occupied or family-trust held

Often not leased, status asset

Income volatility high

Source: Ejari tenancy data and DLD Rental Index Q1 2026 segmentation. Tenant profile typology is broadly consistent with Knight Frank and JLL market analyses.

Short-Term Rental: Where Luxury Closes the Yield Gap

Short-term rental on Holiday Home licenses can lift gross yields by 1 to 3 percentage points in tourist-heavy areas. Marina, Downtown, JBR, and Palm Jumeirah deliver short-term gross yields of 8 to 11 percent compared with 4 to 6 percent long-term. The catch is 15 to 25 percent management fees, DET licensing, cleaning and linen costs, and 70 to 80 percent average occupancy. Net uplift is usually 1 to 3 percentage points after costs.

8. Golden Visa, Mortgage Access, and Buyer Strategy by Segment

Visa eligibility and mortgage terms now shape segment choice as much as yield. The 2026 rule changes materially shifted what affordable and luxury can do strategically.

Golden Visa Threshold Snapshot, 2026

  • 10-year Golden Visa: AED 2 million minimum total property value. Off-plan qualifies. Mortgaged property qualifies with bank NOC (UAE Government portal, Feb 2026 circular).
  • Multiple properties can be aggregated to meet the AED 2 million threshold. Two JVC apartments at AED 1 million each can qualify.
  • 2-year property investor visa: no minimum value for sole ownership as of April 2026. Joint ownership requires each owner to hold a share of at least AED 400,000.
  • 5-year retirement visa: AED 1 million property minimum, age 55 plus.

Source: UAE Government portal, Dubai Land Department Cube Centre circulars February and April 2026. Verify current rules via the GDRFA or DLD before relying on visa entitlement.

Mortgage Loan-to-Value by Segment

Segment

Max LTV for Residents

Max LTV for Non-Residents

Note

Affordable and mid-market (under AED 5M)

Up to 80 percent (first home)

Up to 60 percent typically

First-property buyers get higher LTV

Property AED 5M to 10M

Up to 65 to 70 percent

Up to 50 to 60 percent

Bank policy varies

Luxury and ultra-luxury (AED 10M plus)

50 to 60 percent typical

40 to 50 percent typical

Most luxury deals are cash or low LTV

Source: UAE Central Bank residential mortgage regulations and major UAE bank LTV policies, 2026. Confirm exact LTV with the financing bank before relying on a leverage assumption.

The Cash-on-Cash Return Gap with Leverage

Cash-on-cash return is the actual return on the money you put in, not the full property value. This is where leverage tilts the math toward affordable and mid-market property. Most affordable buyers access 75 to 80 percent LTV mortgages. Luxury buyers often cannot or do not finance because of LTV caps.

Example: an AED 1 million JVC 1BR with 80 percent LTV deploys AED 200,000 of buyer capital plus AED 40,000 DLD fee, total AED 240,000. Net rent of AED 50,000 after service charges and vacancy translates to roughly 20 percent cash-on-cash return before mortgage interest. The same buyer putting AED 5 million cash into a Downtown 2BR earns 3.6 percent net yield on full capital, with no leverage amplification. Mortgage interest at current rates (around 4.5 to 5.5 percent) compresses the cash-on-cash gap but does not close it.

The data shows leverage is the most under-discussed advantage of affordable property investment. Without it, the segment trade-off is yield versus growth. With it, affordable property cash-on-cash returns can exceed 15 percent in year one, before any capital appreciation.

9. Pros, Cons, and the Investor Decision Framework

Luxury Property: Pros and Cons

Pros:

  • Stronger 5-year and 10-year capital appreciation in core luxury areas (Palm Jumeirah, Downtown).
  • Single-asset Golden Visa qualification with cleaner documentation.
  • Branded residences carry an approximate 40 percent price premium per sqft and resell faster in their tier (Betterhomes, 2025).
  • Strong end-user demand from HNW buyers provides a price floor.
  • Lower transaction frequency, fewer tenant management headaches.

Cons:

  • Net yields of 2.5 to 3.8 percent are below the citywide average.
  • Service charges on branded stock can reach AED 55 to 68 per sqft, materially compressing returns.
  • Higher absolute capital outlay locks up cash.
  • Ultra-luxury time on market can exceed 6 to 12 months.
  • Mortgage LTV caps mean cash-on-cash returns are lower than affordable property.

Affordable Property: Pros and Cons

Pros:

  • Net yields of 5.2 to 7.5 percent deliver real cash flow from day one.
  • High LTV access for residents (up to 80 percent) amplifies cash-on-cash returns.
  • Multiple smaller units can diversify tenant and vacancy risk.
  • JVC delivered approximately 75 percent price growth from 2020 to 2026, ahead of the citywide 57.9 percent average (DLD records, DXB Interact).
  • Lower service charges preserve more of the gross rent.

Cons:

  • Supply-heavy newer towers can see time on market stretch to 4 to 6 months.
  • Capital growth in affordable areas is forecast at 2 to 7 percent in 2026, below premium and luxury bands.
  • Tenant turnover is higher, raising vacancy and re-letting costs.
  • International City and similar areas carry lower resale premium and weaker brand recognition.
  • Property management complexity multiplies with multi-unit portfolios.

Investor Decision Framework: Buy If, Walk Away If

Buy luxury if:

  • Your hold horizon is 7 years plus.
  • You want capital preservation and global brand resilience.
  • You need single-asset Golden Visa qualification with simpler documentation.
  • Monthly cash flow is not your primary goal.

Buy affordable if:

  • Cash flow is essential to your investment thesis.
  • You want to use mortgage leverage to amplify cash-on-cash returns.
  • Your hold horizon is 3 to 5 years and you want stronger near-term yield.
  • You are comfortable managing tenant turnover.

Walk away if:

  • You are buying luxury for yield alone. The numbers do not work.
  • You are buying affordable in a supply-heavy tower with more than 5 percent of units already listed for resale.
  • You cannot fund the 4 percent DLD fee and 10 to 20 percent down payment upfront.
  • Your hold horizon is under 3 years. Transaction costs and friction will eat most of the return.

Disclosures

Data sources used in this article include Dubai Land Department (DLD) transaction records, RERA Mollak service charge filings, DLD Rental Index Q1 2026, Ejari tenancy data, Property Finder listing data, Bayut listing data, Knight Frank Dubai residential reports, Cavendish Maxwell quarterly data, Betterhomes Dubai branded residences research 2025, JLL UAE Living report, DXB Interact analytics, Luxhabitat Dubai service charges guide April 2026, and Gulf News market coverage. Reference period for transaction figures is January 2020 to April 2026 unless otherwise stated.


Buyers should verify every data point before any financial commitment. Service charges should be confirmed via the Mollak portal for the exact tower. Rental comparables should be verified via Ejari and the DLD Rental Index through the Dubai REST app. Mortgage LTV and interest rate quotes should be obtained in writing from the financing bank. Golden Visa eligibility should be confirmed via the GDRFA or the DLD Cube Centre. Past performance is not a guarantee of future returns.


Estimates are labelled where direct verification was not possible at time of publication. Forward-looking growth forecasts for 2026 come from third-party market reports and reflect indicative ranges, not contractual returns. Time-on-market and tenant profile figures are typology benchmarks; tower-level and unit-level variation is significant. Run your own due diligence on the specific tower, view, and floor before transacting.
 

Thinking About Investing in Dubai Property?

Frequently Asked Questions

Is luxury or affordable property in Dubai a better investment in 2026?

Neither is better universally. Affordable property in JVC, Dubai South, and International City delivers gross yields of 7 to 10 percent and net yields of 5.2 to 7.5 percent (DLD Rental Index Q1 2026). Luxury property on Palm Jumeirah and Downtown Dubai delivers gross yields of 4 to 5.5 percent but stronger capital appreciation, with Palm Jumeirah villas growing 14 to 22 percent annually in recent years (Knight Frank, DLD records 2024 to 2025). Affordable wins on cash flow and leverage. Luxury wins on capital preservation and prestige. Total annualised return over 5 years has been roughly comparable: 17 to 20 percent across both segments. Choose based on whether you need income today or wealth at exit. Run a net yield calculation using Mollak filings for the specific tower before committing.

Which Dubai community offers the highest net rental yield in 2026?

International City currently offers the highest gross yields in Dubai at 8 to 9 percent, with entry tickets from AED 250,000 (DLD records and Property Finder data, Q1 2026). Net yields after service charges of AED 7 to 10 per sqft sit at approximately 6 to 7.2 percent. JVC follows at 7 to 8 percent gross and 5.8 to 6.5 percent net for the right tower. Dubai South and Dubai Sports City fall just behind. The trade-off is that International City has weaker resale liquidity and lower capital appreciation than JVC. The data shows yield-only investors can choose International City for income; balanced investors usually prefer JVC. Verify the Mollak service charge and three Ejari rent comparables for the specific building before booking.

How much does it really cost to own a Dubai property each year after the purchase price?

On an AED 1 million JVC 1BR, annual ownership costs run approximately 12 to 15 percent of gross rent. That includes service charges (AED 8,000 to 14,000), district cooling capacity charges where applicable (AED 600 to 1,000 per cooling ton in JLT, Marina, Business Bay, Palm), property management fees if used (5 to 8 percent of rent), vacancy reserve (5 to 8 percent of annual rent), and maintenance reserve (0.5 to 1 percent of property value). On Palm Jumeirah luxury stock, annual costs can reach 25 to 35 percent of gross rent because of higher service charges and management complexity. This is non-negotiable due diligence: pull the Mollak filing and run a net yield calculation before signing any SPA.

Can I get a Golden Visa with affordable property in Dubai?

Yes, provided the aggregate property value reaches AED 2 million (UAE Government portal, Feb 2026 circular). Two JVC apartments at AED 1 million each, or one Business Bay 1BR plus one JVC studio, can qualify. The 50 percent upfront payment requirement was removed in February 2026; only the total purchase value is now assessed. Off-plan, mortgaged, and combined-title-deed purchases all count. Properties must be in a freehold zone and registered under the applicant's name. The 2-year property investor visa now has no minimum value for sole ownership (April 2026 rule change). Confirm eligibility via the GDRFA or the DLD Cube Centre before relying on visa entitlement as part of your buy decision.

What is the difference between cash-on-cash return and rental yield in Dubai property?

Rental yield is annual rent divided by full property value. Cash-on-cash return is annual net cash flow divided by the actual capital you put in, including mortgage down payment and fees. On an AED 1 million JVC 1BR with 80 percent LTV, you deploy AED 200,000 plus AED 40,000 DLD fee. Net rent of approximately AED 50,000 after service charges and vacancy translates to roughly 20 percent year-one cash-on-cash return before mortgage interest. Mortgage interest at 4.5 to 5.5 percent compresses this to 12 to 15 percent. The same investor putting AED 5 million cash into a Downtown 2BR earns 3.6 percent net yield with no leverage amplification. Leverage is the most under-discussed advantage of affordable property. Confirm bank LTV in writing before relying on a leverage assumption.
Kamal Garg
Kamal Garg
Dubai Property Consultant

Kamal Garg is a Dubai Property Consultant at Honey Money Real Estates (ORN: 28658), with over 8 years of experience building investor portfolios across the UAE and South Asian markets.... Read More

Share Our Post